
Nutrition is key to promoting positive health outcomes and preventing chronic diseases such as high blood pressure, diabetes, and obesity. Individual nutritional intake is affected by a multitude of factors outside of food consumption habits. One of the most important neglected determinants of a healthy diet is the food environment. The food environment and food security are directly linked to diet-related chronic disease outcomes, including obesity.
Food insecurity is a leading health and nutritional issue in the United States. In 2021 the United States Department of Agriculture (USDA) reported that 10.2%, or 13.5 million, of U.S. households were food insecure. According to the USDA, food insecure households are those that at some point during the year were uncertain of having or did not have their food needs met due to insufficient resources to access food. Food insecurity was higher than average in households with children (12.5%), households with children headed by a single woman (24.3%) or man (16.2%), and Black, non-Hispanic (19.8%) or Hispanic (16.2%) households. These statistics emphasize that food insecurity disproportionately impacts certain groups, pointing to the need for equitable solutions.
Nuanced relationships characterize the relationship between food insecurity and obesity for different groups. A systematic review of food insecurity and childhood obesity found a possible association for girls and children who experienced food insecurity at multiple points during the year. Among adult populations, food insecurity is associated with a higher waist-to-height ratio in women, but not men. Outside of obesity, food insecurity is linked with poorer health outcomes for children and adults, including lower nutrient intakes, cognitive problems, anxiety, diabetes, hypertension, hyperlipidemia, and worse sleep outcomes.
The local food environment affects the nutritional status and weight outcomes of residents in the area. Food deserts, defined as geographic areas where residents have little to no options for purchasing healthy food, have been associated with elevated rates of obesity. When a neighborhood has no grocery stores with healthy food options, residents experience poorer health outcomes. For example, in two low-income, African American neighborhoods in Pittsburg, every one mile increase in the distance that residents traveled to shop for food increased the odds of obesity by 5%. Although people with obesity are often blamed for making poor food choices, the food options available determine the choices that people make.
Additional studies have demonstrated that the presence of unhealthy food is a stronger predictor for obesity outcomes than the absence of healthy food options. Food swamps are geographic areas with a high density of retail options selling high-calorie fast food and snack food options, compared to healthy food options. Researchers from the Rudd Center for Food Policy and Obesity at the University of Connecticut found that living in a food swamp is a stronger predictor for obesity rates than living in a food desert. This effect was stronger in counties with greater income inequality and less mobile residents.
This year, the Urban Institute, a nonprofit organization that conducts economic and social policy research, released a report entitled, “Retail Food Access and Obesity Prevalence”. The report focused on the association between the number and quality of food establishments and obesity rates by county across the United States. The report observed that counties with high-obesity rates had a similar number of grocery stores as counties with low obesity rates, but more convenience stores, dollar stores, and gas stations, which sell processed, high-calorie foods.
Below is a map from the Urban Institute’s report that shows which counties have higher percentages of unhealthy food establishments as well as higher rates of obesity. The darkest color indicates high amounts of both. The purple shades indicate high rates of obesity and low percentage of unhealthy food establishments, while orange indicates a high percentage of unhealthy food establishments and a lower rate of obesity.
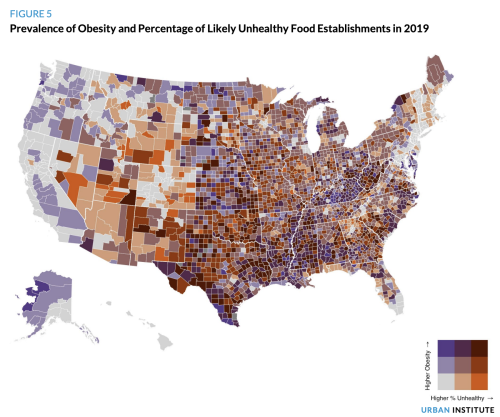
Source: Waxman, et al.
The complex nature relating individual food intake and nutrition status with the food environment indicates the need for further research to better understand how obesity can be addressed through a multi-level, societal approach.